The sank below the key level of 1,900, and traders now have their eyes on the 1,867 support level.
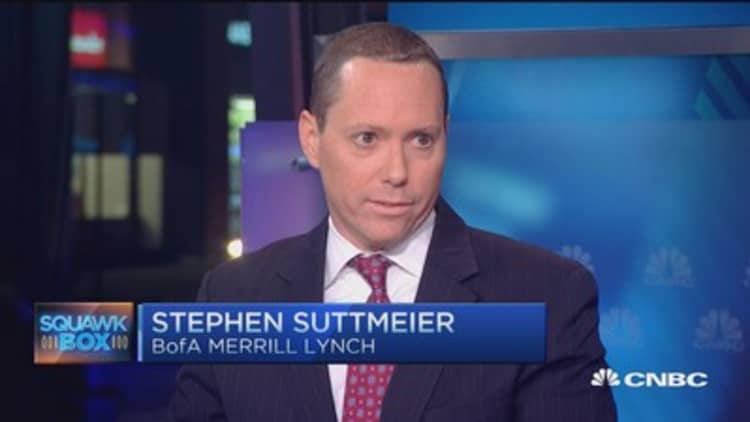
But we could very well be heading for 1,600, said Stephen Suttmeier, chief equity technical strategist at Bank of America Merrill Lynch Global Research.
"What happens if we start to lose 1,867? You can basically say if we do that we may actually have a top in place that's formed over last year," he told CNBC's "Squawk Box."
"If that happens, what does that count to? It counts to about 1,600. That's what it counts to on the charts," he said. "If you take the chart pattern there and project it down, that's the risk."
He noted that some market signals are indeed flashing signs of a top, and overhang is apparent in indicators of breadth, volume, trend, and high yield.
Should that happen, stocks would retest the 1,575 level, where the S&P broke out in April 2013.
Given the S&P's 2.5 percent drop on Wednesday, indicators of panic should have been higher, Suttmeier said, adding that he wasn't getting calls from clients to sell. Those panic indicators are what create tradable bounces, he noted.
While the secular stock trend is still bullish, Suttmeier said he sees suggestions a cyclical bear market has set in.
"Cyclically we are at risk if we break 1,867. We could go lot lower. Secularly, I think we've got to stay bullish. We've got a lot of support around 1,600 on the S&P," he said.


